Personal Financials - Facts and Figures
Jul 1, 2024

So, how do you stack up – financially. Where do you fit into what is seemly a world fill with people who have low financial literacy and even less financial resources? And why does it matter? Those are the topics of this blog post.
Lets start with the second question. Why does it matter that you know where you stack up? One of the life lessons I have had is that it is a slippery slope when you compare yourself to someone else. You are you and you have your own gifts, talents, and purpose in life. o compare yourself to your potential, not someone else’s. True.
However, it is important to have guide posts to help point you in the direction you want to go. Comparing yourself to trends helps you gauge if you are where you want to be and can motivate you to action if you need it. It can also help reduce the feeling of being overwhelmed and defeated knowing you are not along.
Many people I talk with shy aware from working on their personal finances because they know they are not in a good place – they are embraces. This is natural. However, if you take the emotion out of it you can use these facts and figures as a guide and motivation to improve your personal financial situation.
Below are facts and figures from a varsity of sources the paints a picture of the state of today regarding personal finance. These facts and figures are organized into four categories:
Financial Literacy
Income
Spending
Savings
As you look at these facts and figures, ask yourself two questions:
Am I where I wanted to be at this stage of my life?
Do I need to increase, keep the same, or lower my attention to my personal finances.
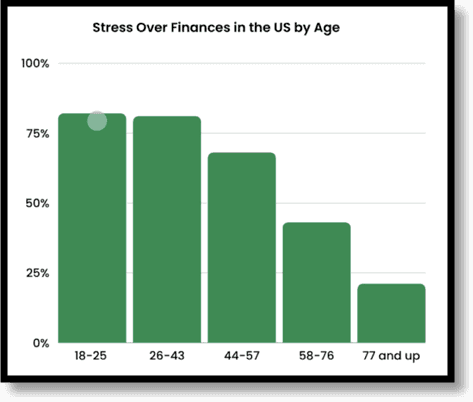
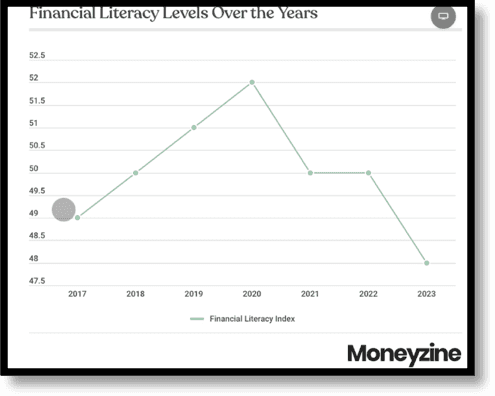
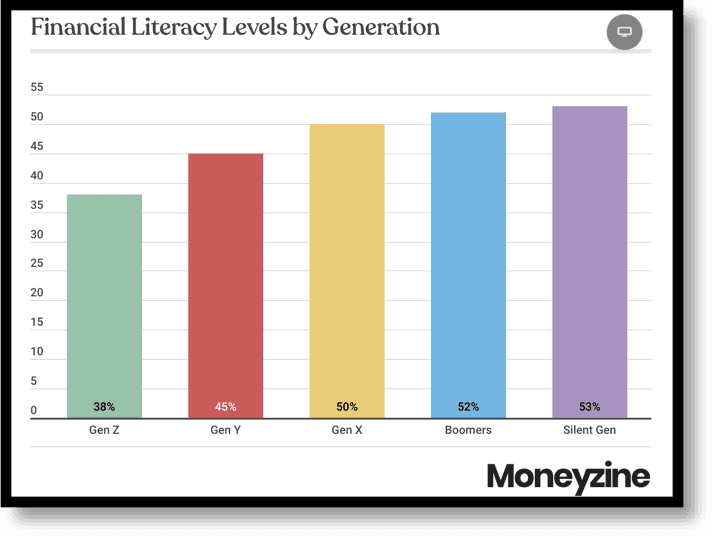
Financial Literacy
63% of American say money is a significant source of stress – source: Millennial Money – American Psychological Association
31% of American are considered financially healthy -according to the Financial health Networks annual Financial Health Pulse report
24% of millennials demonstrate basis financial literacy – source: national Endowment for the Financial Eduction
Income
According to Statista, the chart below shows the percentage of American by income range.
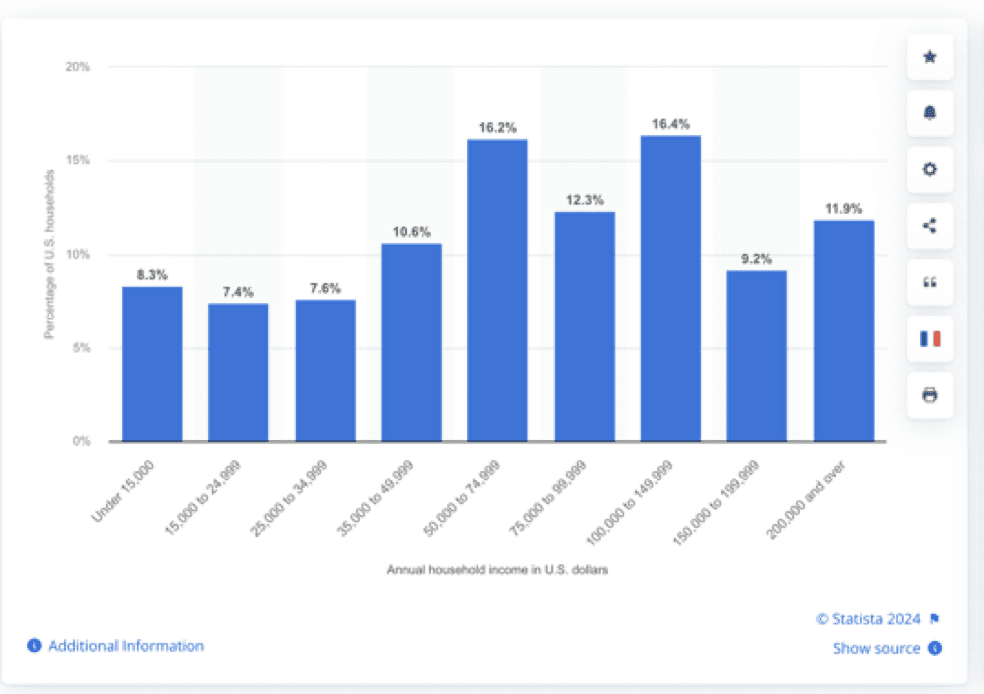
28.5% of Americans earn between $50,000 and $100,000 per year
37.5% earn above $100,000 per year
The two income ranges with the highest percentage of Americans are $50k - $75k and $100k - $150k.
49.8% (just under 50%) of Americans earn $75k or more per year
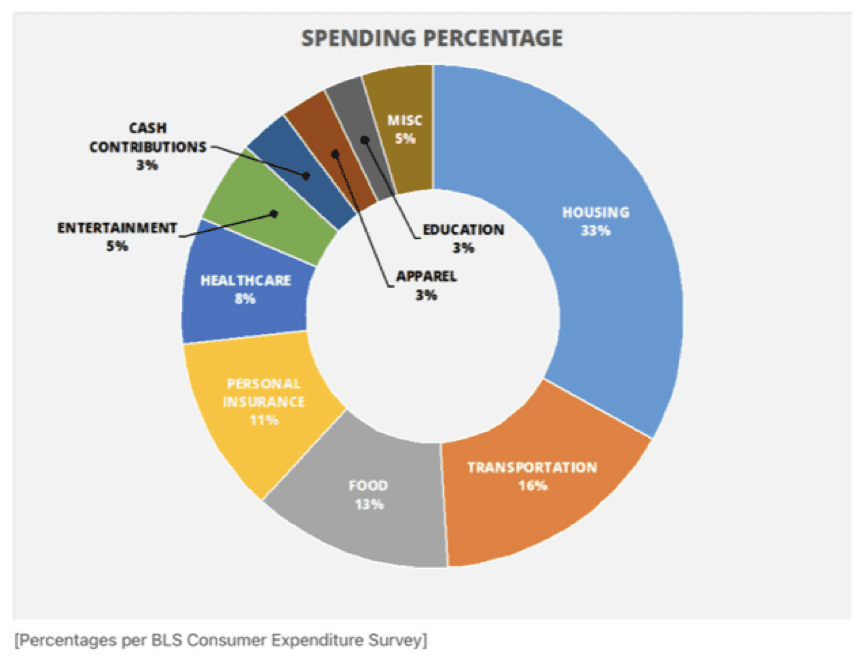
Spending
According to data from the Bureau of Labor Statistics, Americans biggest single expense if mortgage or rent. Based on the 2022 Consumer Expenditures Survey, the top 5 categories of spending are:
Housing: 33.3%
Transportation: 16.8%
Food: 12.8% (43% of which is on (restaurants or take out)
Insurance/pension: 12%
Healthcare: 8%
According to the Paycheck to Paycheck report from PYMTS and LedingClub:
61% of adult consumers lived paycheck to paycheck in 2022, a 9% increase from 2021
36% of people who earn $250,000 or more reported they still live paycheck to paycheck
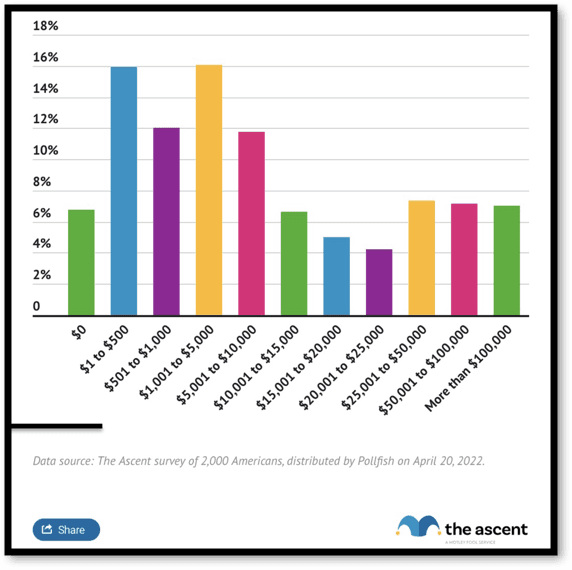
Saving
The data suggests American can do a better job with saving for tomorrow:
According to a 2018 survey by GOBrankrates:
58% of survey respondents have less Thant $1,000 in a savings account
40% of Americans have less than $10,000 saved for retirements
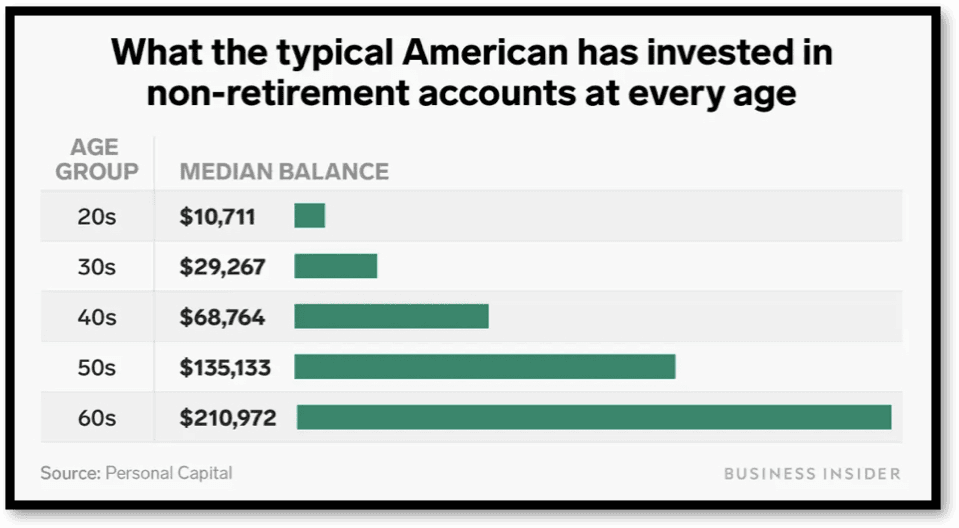
Based on analysis from the Center for Retirement Research in 2017, median retirement savings are well below the recommend savings by age:
35 – 44 years old: $40,000
45 – 54 years old: $97,000
55 – 64 years old: $135,000
Related posts


Get on our newsletter
Stay up to date with new articles, videos,
and product updates.
Enter your email